Configuring Metric Cards
Overview
Metrics Cards are an excellent way to present key performance indicators (KPIs) in a clear and concise manner. They are designed to provide a quick snapshot of critical metrics, enabling you to track progress and make informed decisions at a glance.
Getting Started
Before configuring a Metrics Card, ensure you have:
- A defined metric or KPI you want to monitor
- Access to the relevant dataset within InsightsIQ
- An understanding of the required aggregation method
Business Value
Metrics Cards simplify complex datasets into actionable insights by showcasing high-level summaries. This feature is ideal for dashboards, helping stakeholders stay focused on essential trends without being overwhelmed by details.
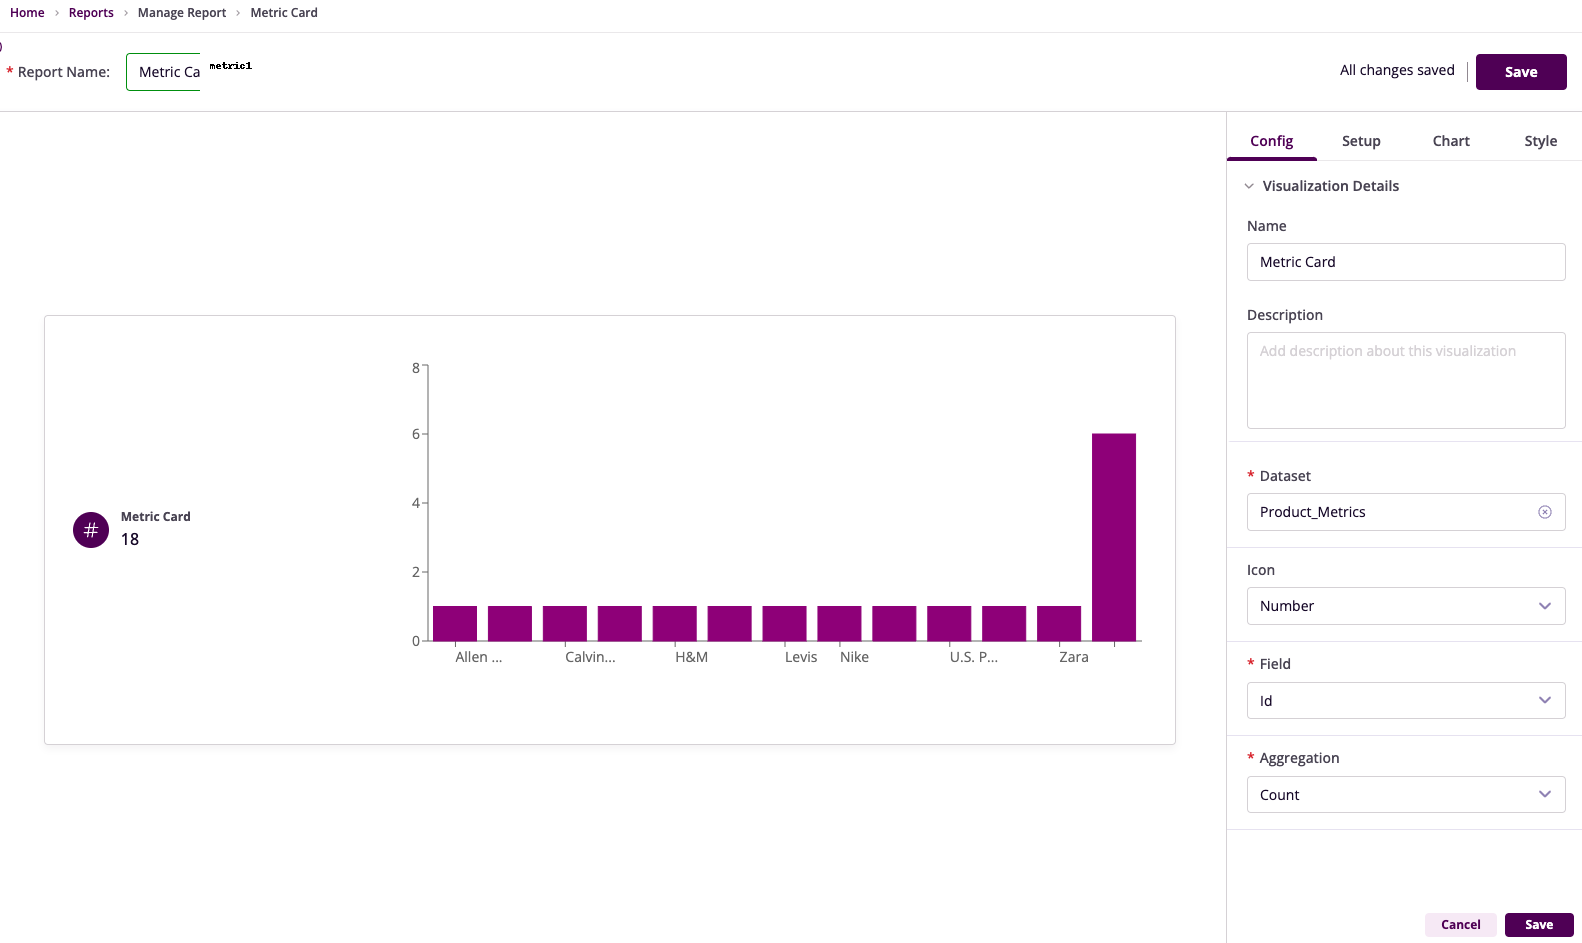
Card Configuration
Basic Configuration
- Name: Provide a meaningful title
- Description: Add a concise explanation
- Dataset: Select the relevant dataset
- Icon: Choose an appropriate icon
Field Configuration
- Field: Select the metric column
- Aggregation: Choose summary method
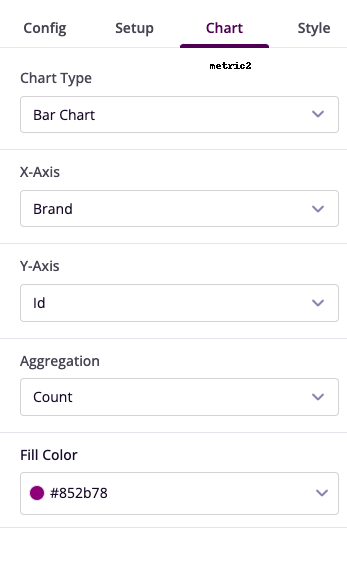
- Chart Type: Select visualization style
- Axis Configuration: Set up X and Y axes
Advanced Features
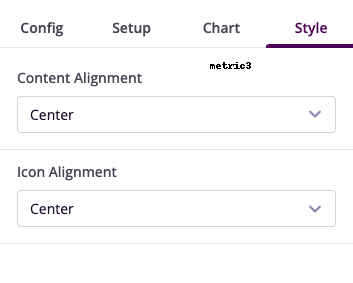
Style Customization
- Content Alignment: Adjust text positioning
- Icon Alignment: Set icon placement
- Visual Elements: Configure colors and fonts
Optional Enhancements
- Filters: Refine data scope
- Chart Visualization: Add trending data
- Color Schemes: Match brand guidelines
Example Use Cases
Monthly Revenue Tracking
- Name: Monthly Revenue
- Field: Revenue
- Aggregation: Sum
- Enhancement: Currency icon
- Insight: Monitor monthly revenue trends
Average Order Value (AOV)
- Name: Quarterly AOV
- Field: Order Value
- Aggregation: Average
- Enhancement: Trend visualization
- Insight: Track order value patterns